UK · Economy
Economy
UK GDP, growth, and international comparison.
Section 1
UK GDP, 1970–2025
UK nominal GDP and GDP per capita
Nominal GDP (£bn) — left axisGDP per capita (£) — right axis
GDP per capita
GDP per capita adjusted for inflation and differences in living costs.
Inflation adjusted
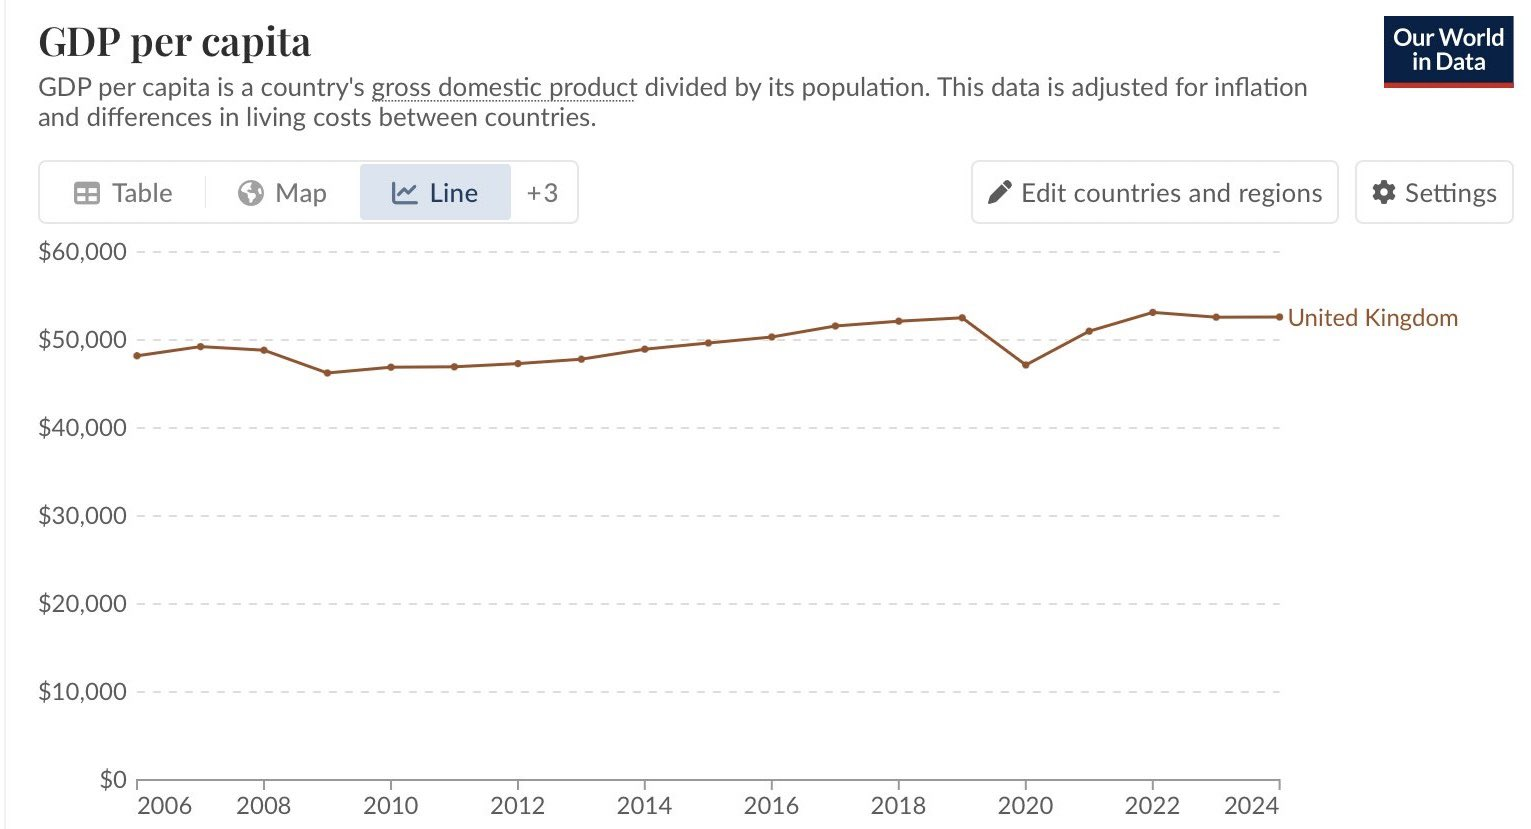
Source concept: Our World in Data / World Bank GDP per capita in constant international dollars.
Section 2
GDP growth, 1970–2025
UK real GDP growth (% per year)
PositiveNegative
UK GDP vs pre-2008 growth trend
Actual nominal GDPPre-2008 trend (5% nominal/yr)
Section 3
UK PPP per capita, 1990–2024
UK GDP per capita (PPP, current international $)
Section 4
G7 GDP per capita comparison (nominal USD)
GDP per capita (nominal USD) — G7 comparison
UKUSACanadaGermanyFranceItalyJapan
Section 5
G7 GDP per capita comparison (PPP)
GDP per capita (PPP, international $) — G7 comparison
UKUSACanadaGermanyFranceItalyJapan
Sources