DemographicsDemographics
Source2021 Census
PeriodBirmingham, 2021 Census

Age-by-age breakdown of Birmingham’s ethnic composition, showing a young, diverse population: White British are a minority among children and working-age adults but the dominant group among the elderly, while Asian, Black, Mixed, and Other groups are concentrated in the younger cohorts.
Open the image at full reading size with its source metadata preserved alongside the visual.
Jump back into nearby visuals from the same theme or tag cluster.
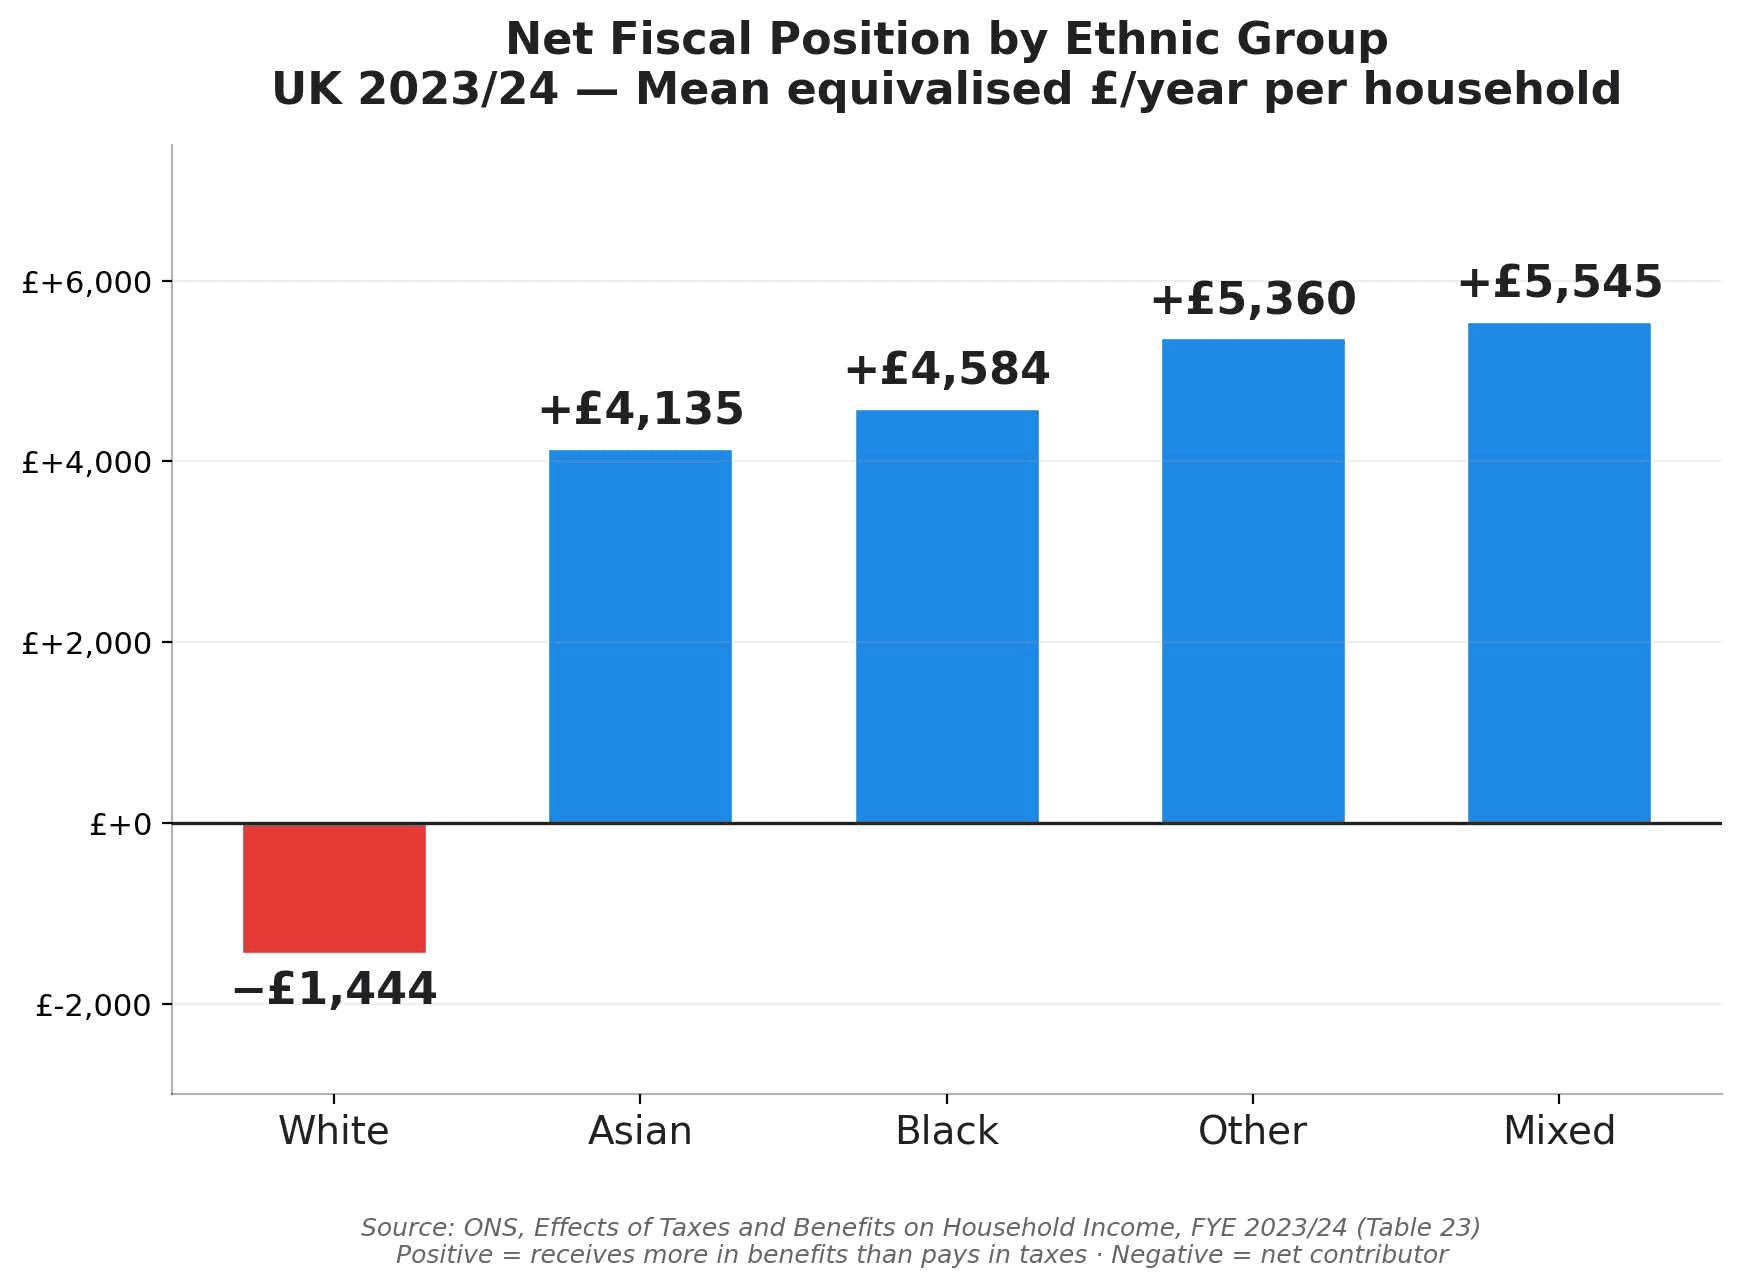
Visual explainer of net fiscal position by ethnic group using ONS taxes-and-benefits data for 2023/24.
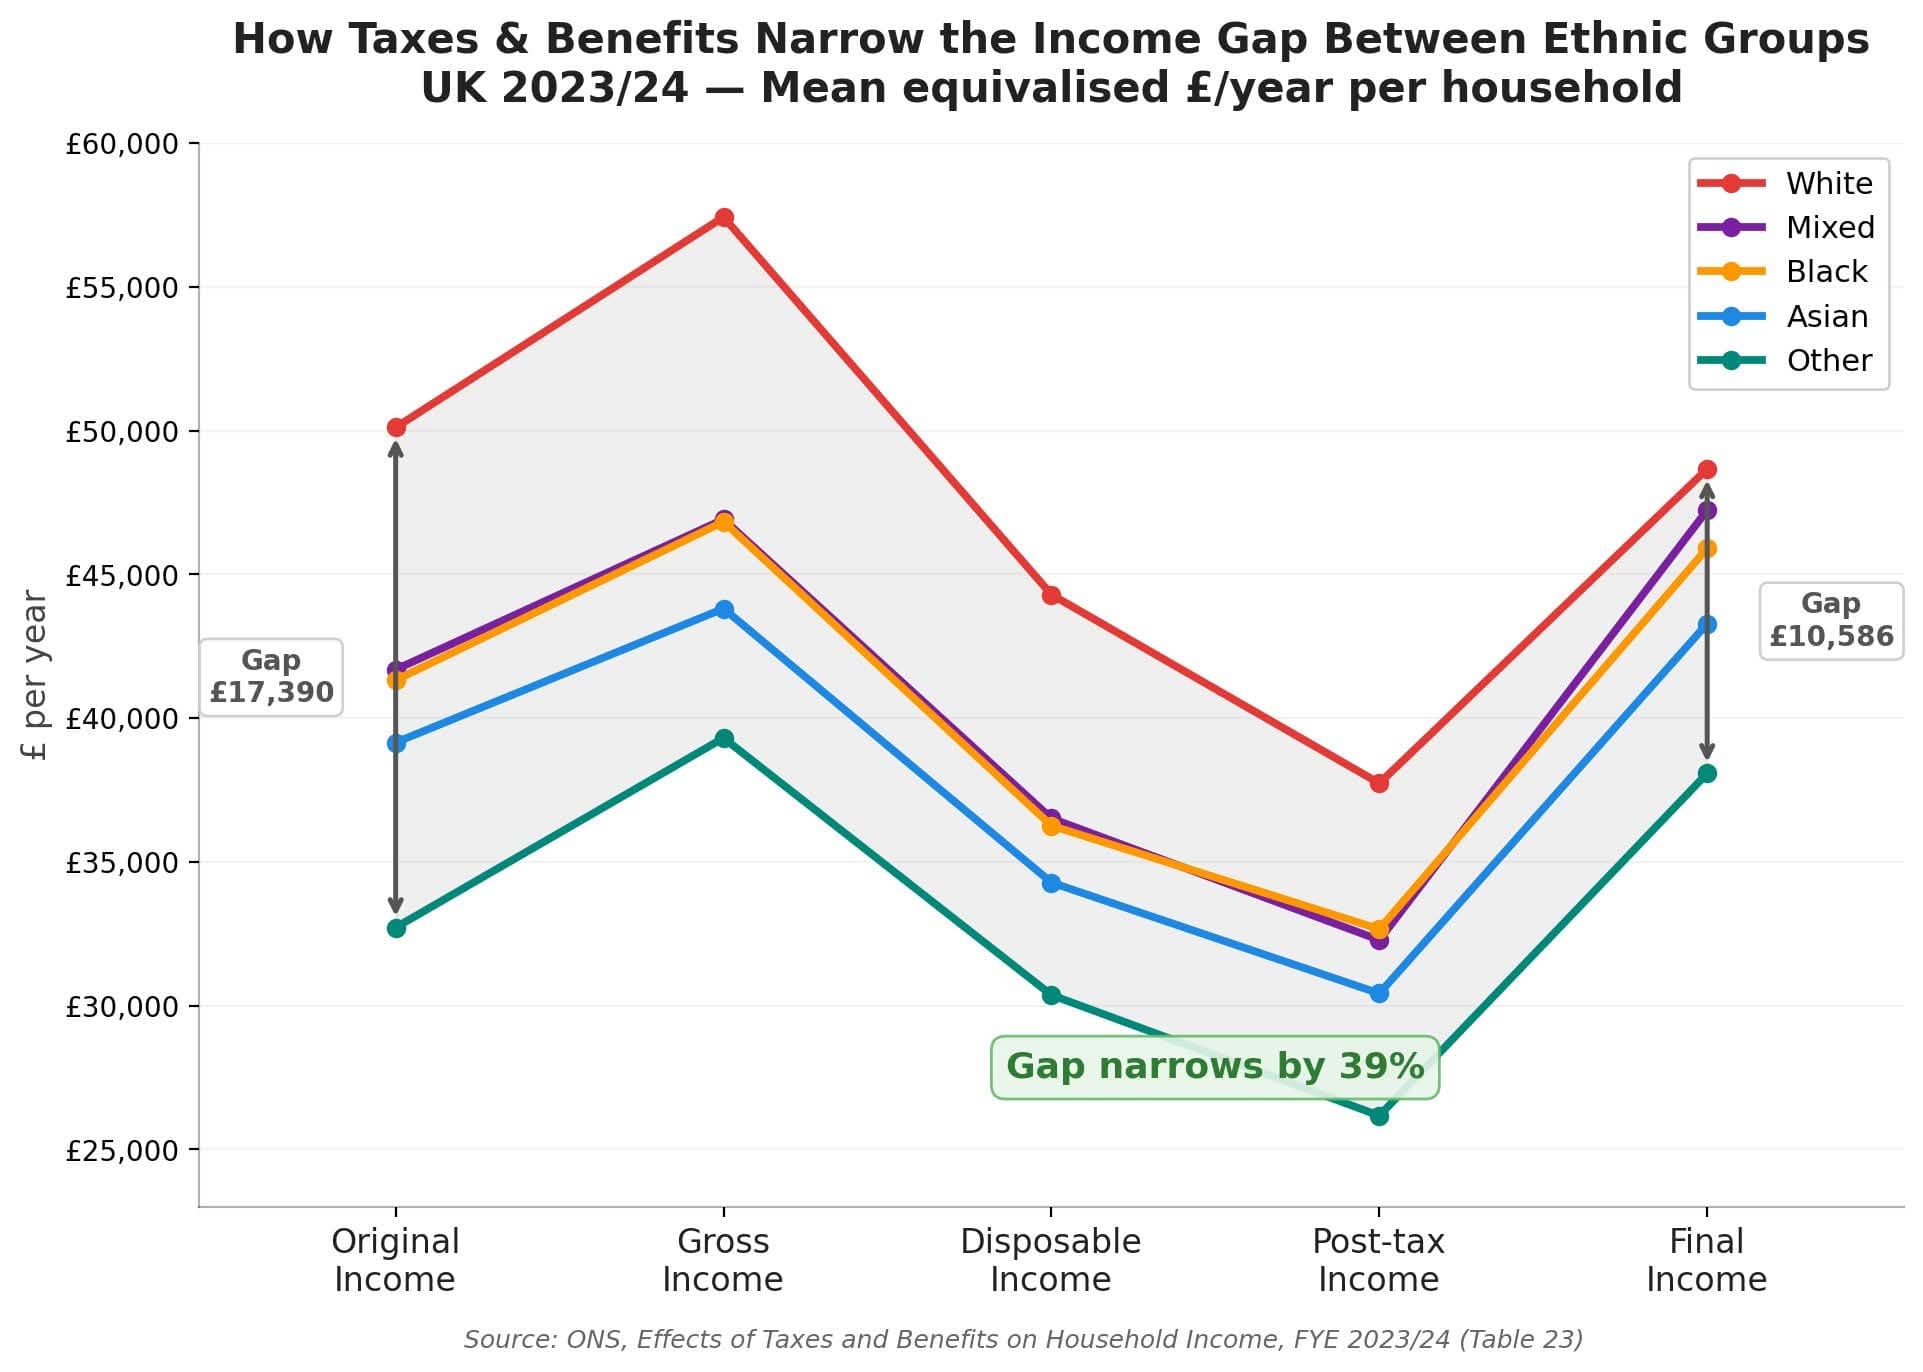
Visual explainer of how taxes and benefits compress post-tax and final-income gaps between ethnic groups, using ONS household income data for 2023/24.
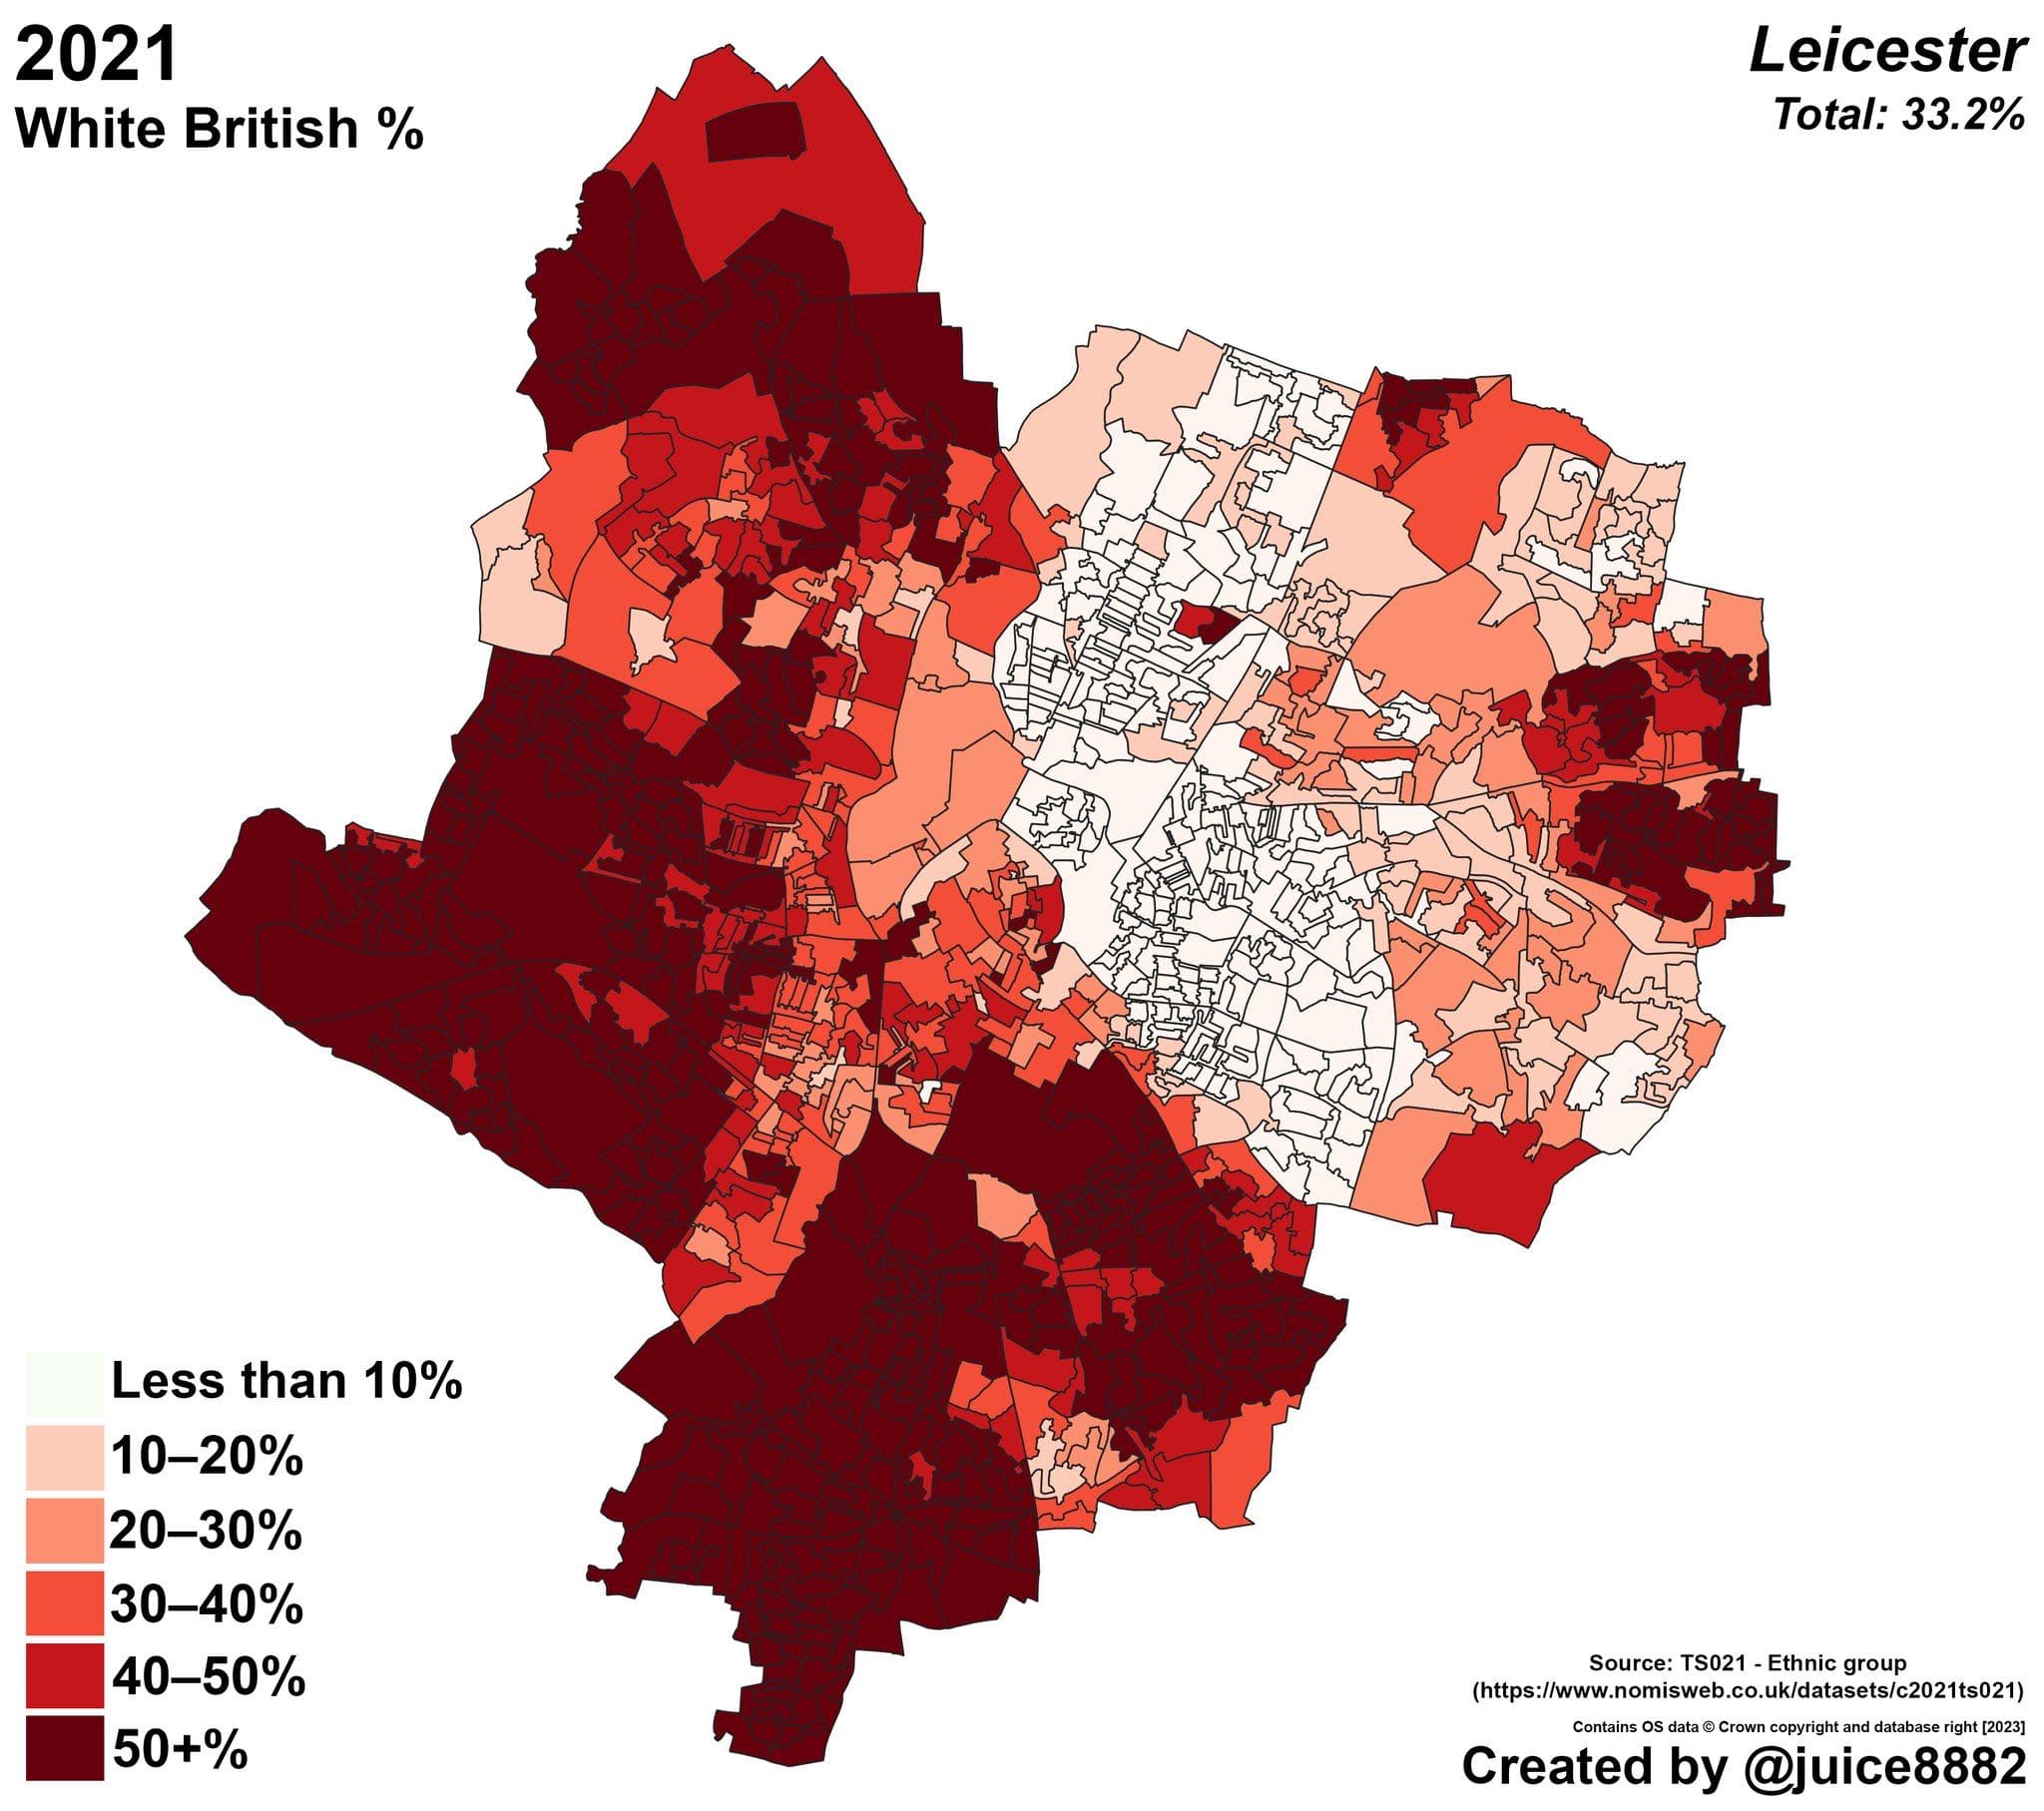
Neighbourhood-level map of Leicester showing the local distribution of the White British population share in the 2021 Census.