DemographicsDemographicsEconomics
SourceONS, Effects of Taxes and Benefits on Household Income, FYE 2019 (derived from Fig. 1: final income minus original income) / chart by @AJR2049 on X
PeriodUK, FYE 2019
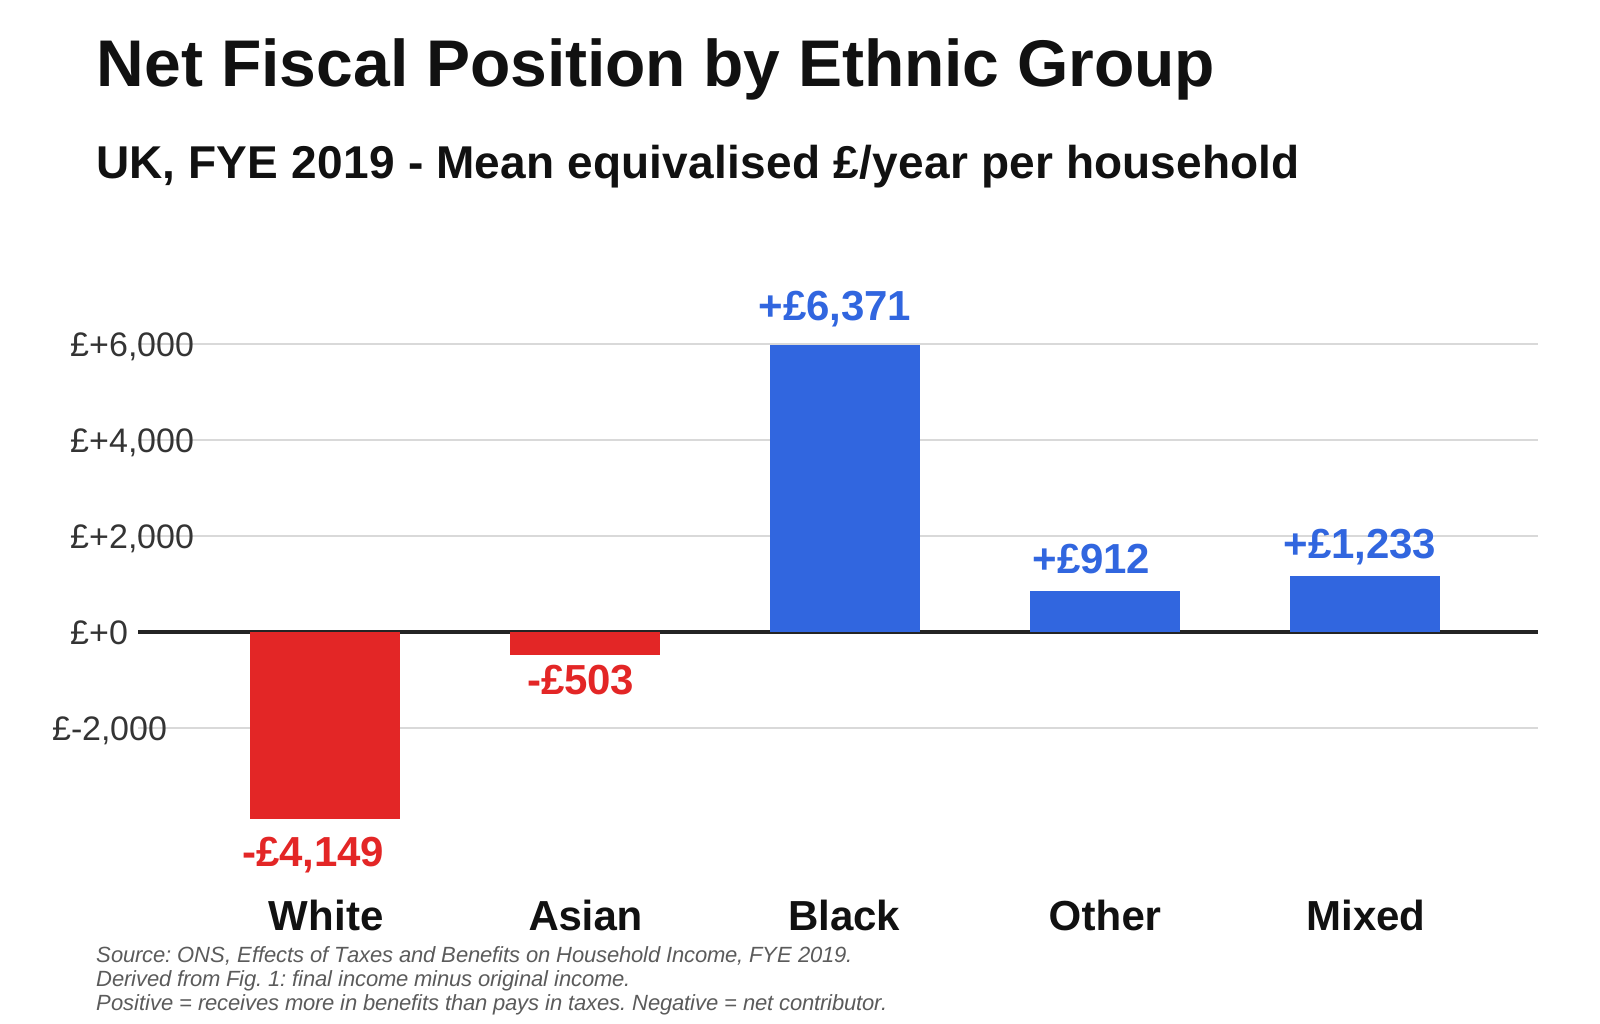
FYE 2019 comparison of net fiscal position by ethnic group, useful alongside the later 2023/24 version to frame the COVID-19 period and the Boriswave-era migration surge.
Open the image at full reading size with its source metadata preserved alongside the visual.
Jump back into nearby visuals from the same theme or tag cluster.
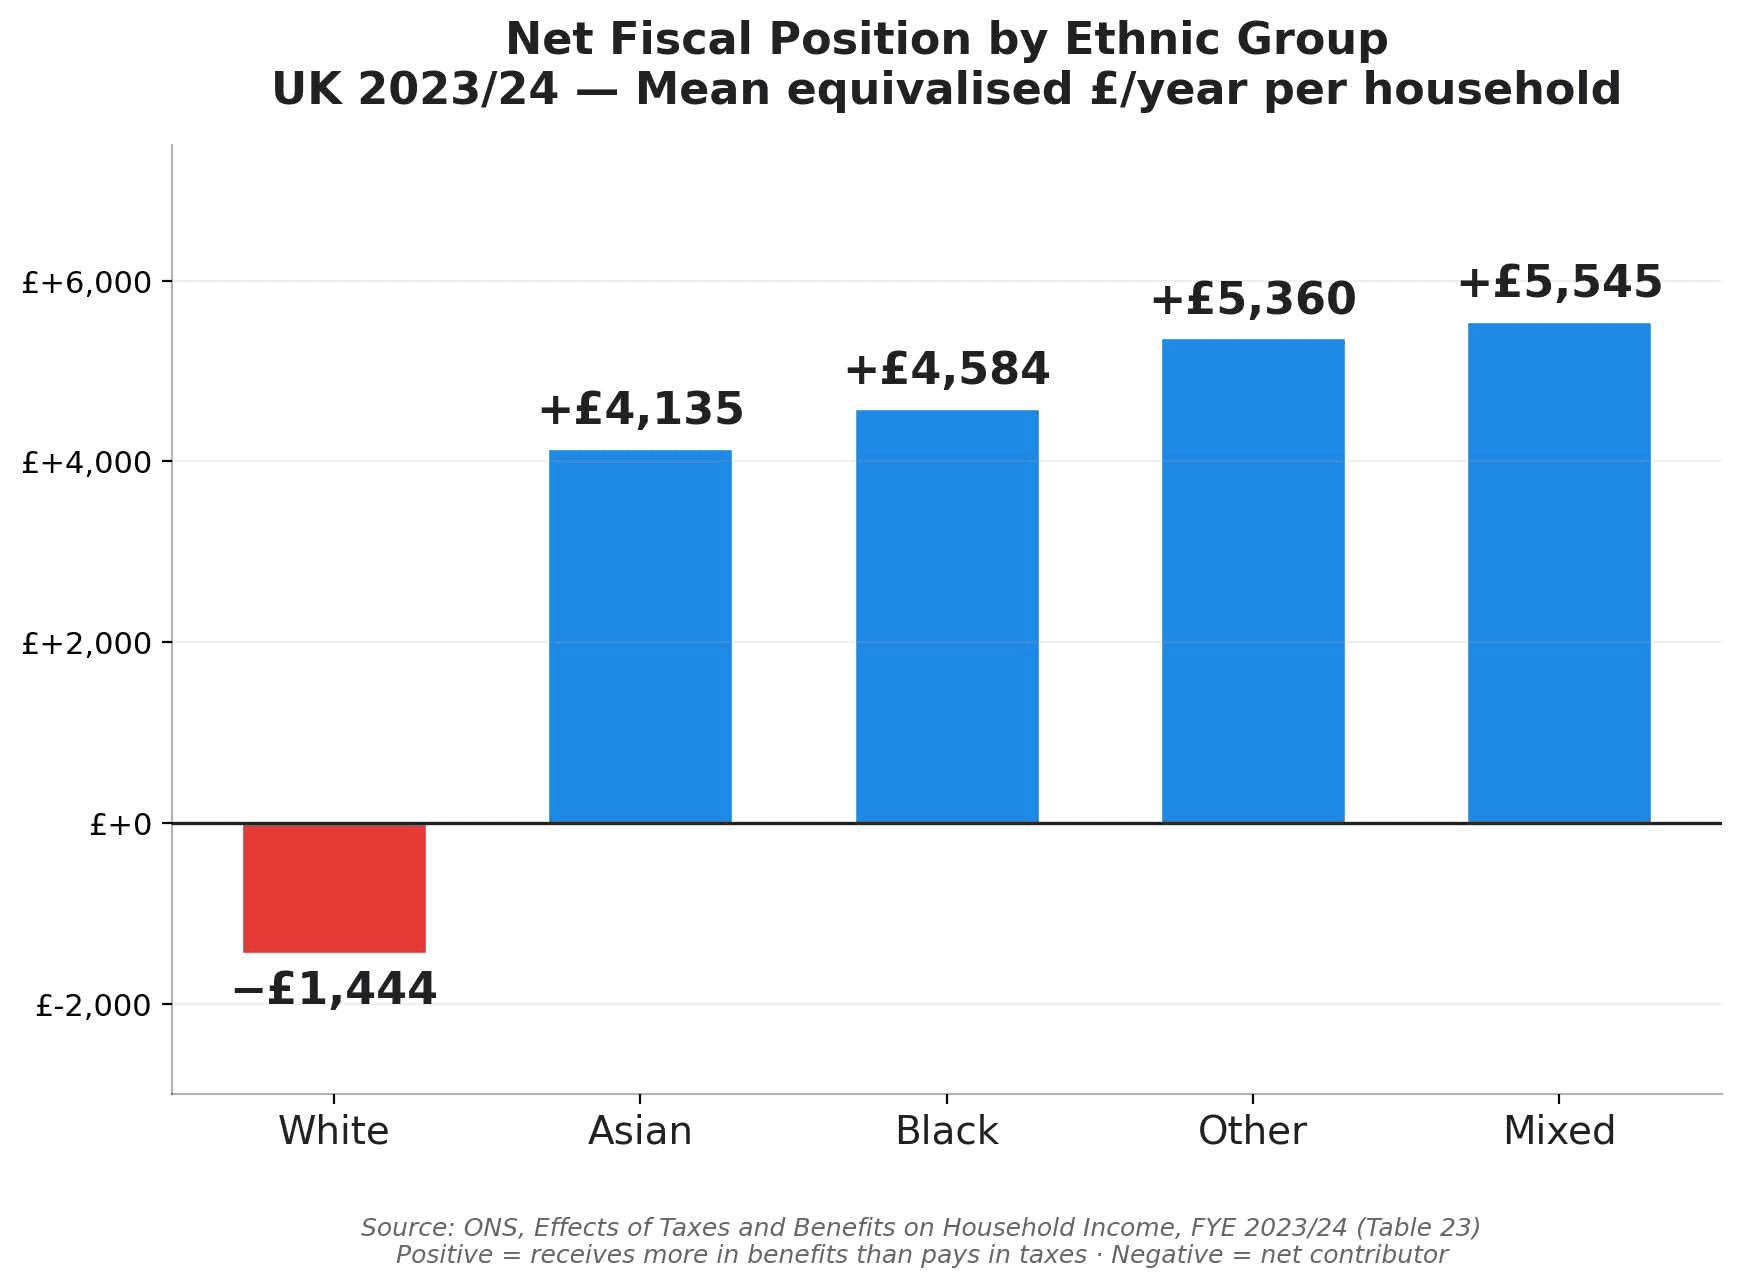
Visual explainer of net fiscal position by ethnic group using ONS taxes-and-benefits data for 2023/24.
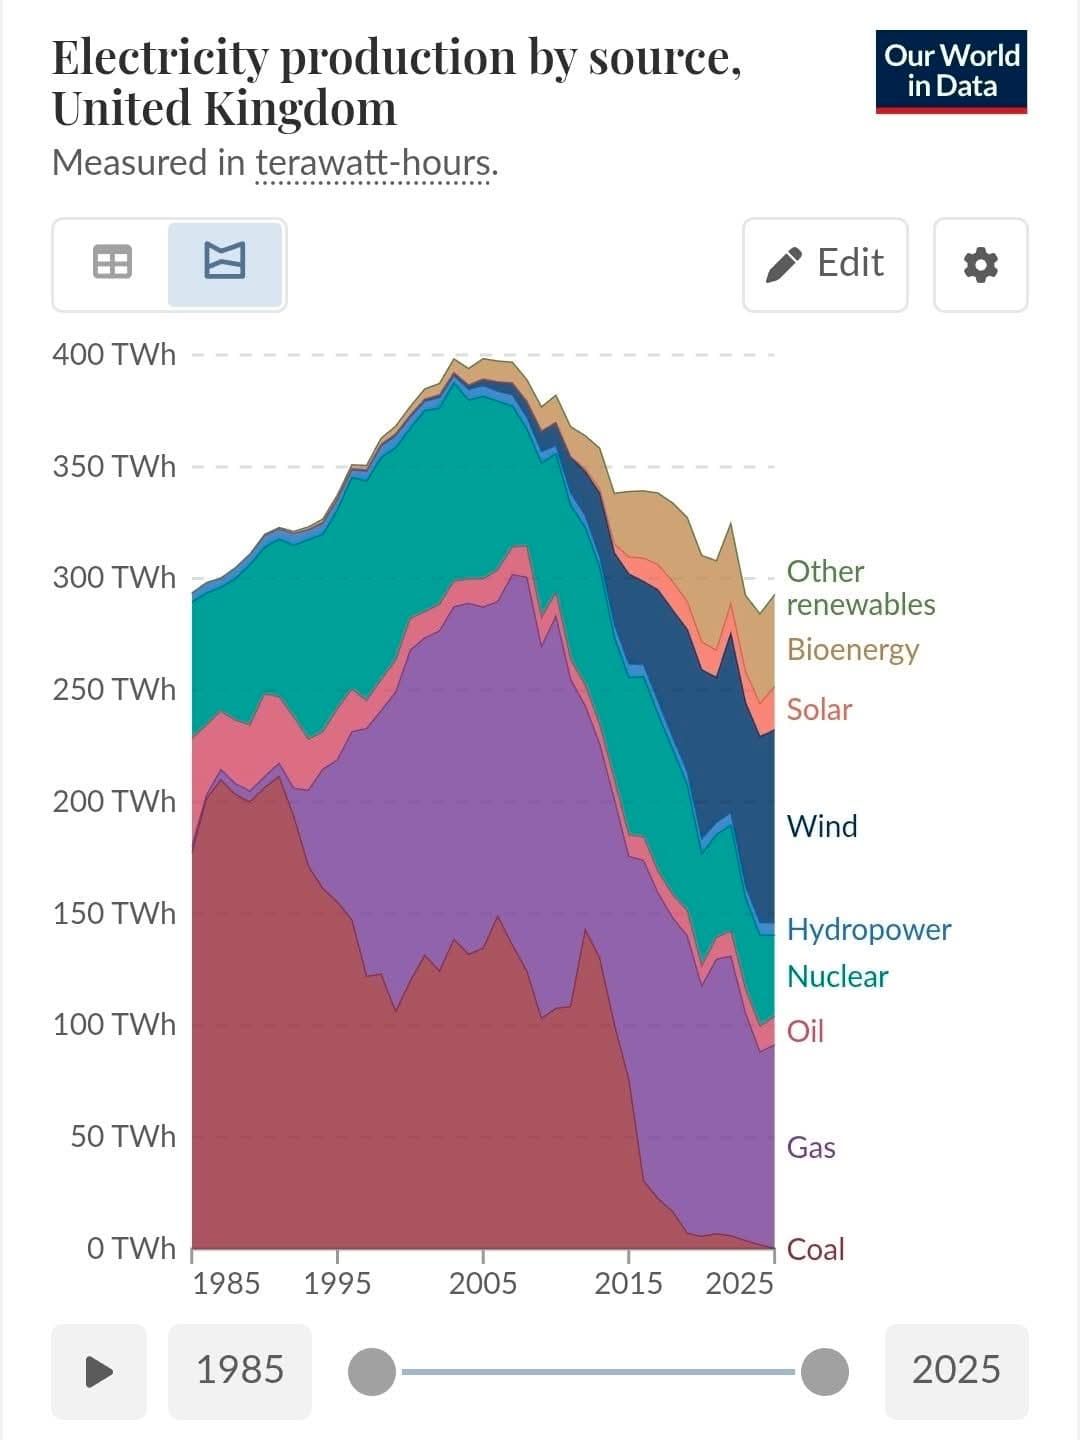
Long-run view of UK electricity generation by source, showing the collapse of coal, the rise of gas, and the later expansion of wind and other renewables.
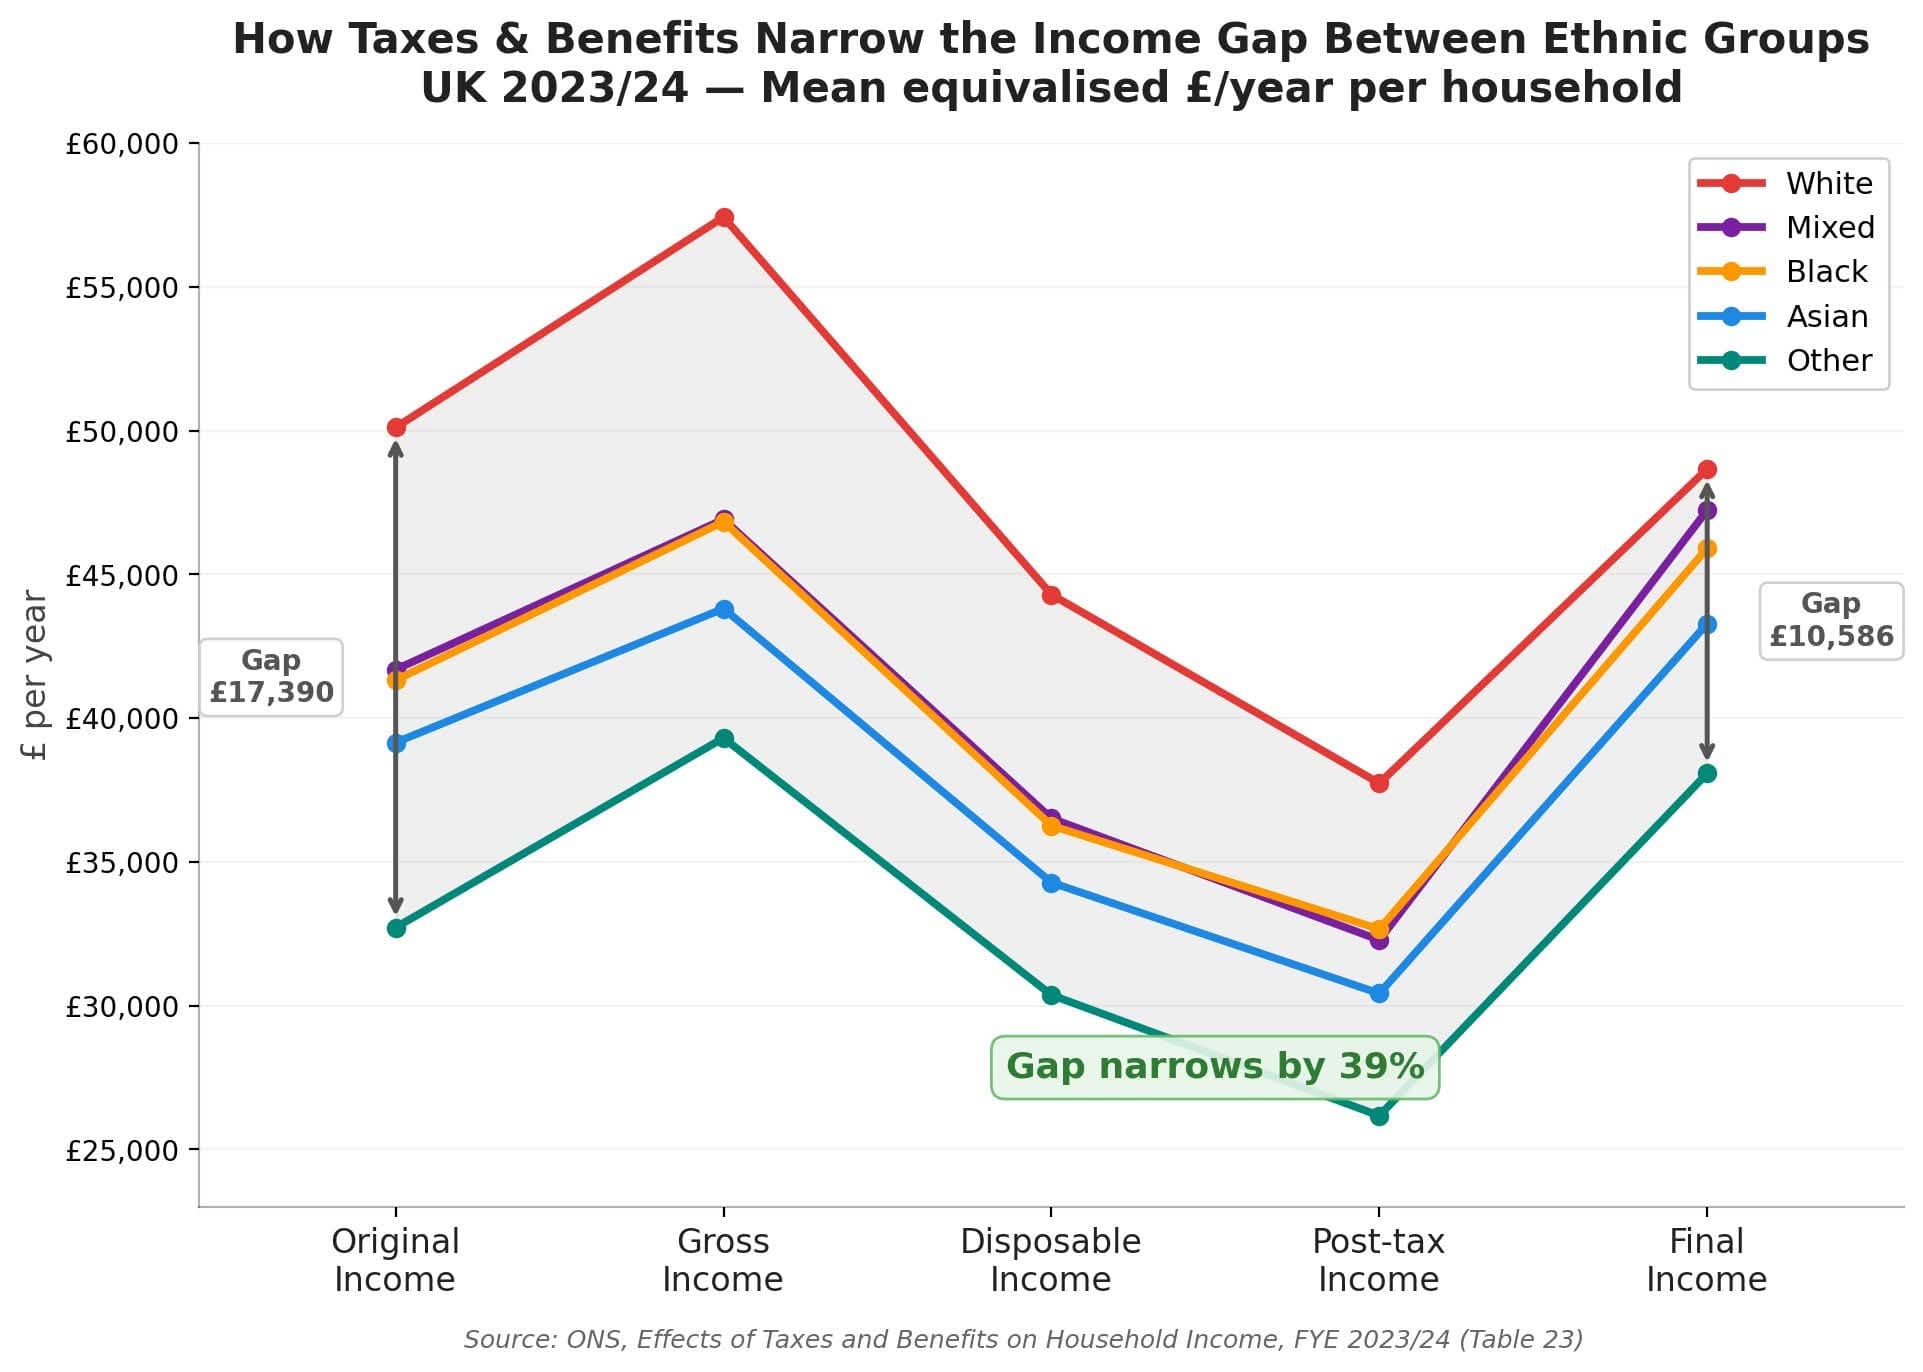
Visual explainer of how taxes and benefits compress post-tax and final-income gaps between ethnic groups, using ONS household income data for 2023/24.