ILR changes: the earned settlement rules
The standard wait for indefinite leave to remain (ILR) on work visas will rise from 5 to 10 years under earned settlement, according to the Home Office (A Fairer Pathway to Settlement: Government Response to the Consultation (CP 1707), published 2 November 2026). No start date had been set when we checked on 4 November 2026.
How ILR rules change under earned settlement
ILR lets someone live in the UK for good, with no visa to renew. It is usually the step before British citizenship. Today the application costs £3,226 per person (Home Office fees table), plus £50 for the Life in the UK test.
| Rule | Before | Under earned settlement | Page |
|---|---|---|---|
| Standard wait on work visas | 5 years for most work visas (3 years for Innovator Founder and Global Talent) | 10 years by default, for people earning at least £12,571 a year in 5 of the last 7 years | p.11 |
| Faster routes | None based on earnings | 5 years if earning £50,271+ in 3 of the last 5 years, or in eligible health or education jobs. 3 years if earning £125,141+ in 3 of the last 4 years | p.11, p.42 |
| Partners and parents of British citizens | 5 years | 5 years (unchanged) | p.13 |
| Claimed benefits (specified public funds) in the last 5 years | No extra wait on most routes | 20 years | p.14 |
| Overstayed or broke visa conditions as an adult | No set extra wait | 20 years | p.9 |
| Entered the UK illegally | No set extra wait | 10 years added to any route | p.34 |
| Refugees | 5 years | 5 years via safe and legal routes; 20 years on Core Protection; 30 years after illegal entry | p.33–34 |
| 10-year long residence route | Open: 10 years of lawful residence on any visa | Closed; time on Student or Graduate visas will not count | p.19–20 |
| English | B1 (about GCSE level) | B2 (about A level) for everyone | p.17 |
| Criminal record | Assessed case by case | Any adult with a UK criminal record is refused | p.8 |
Children, people aged 65 or over and people with a physical or mental condition that stops them working are exempt from the earnings rule (CP 1707, p.11). Couples can combine incomes to reach £25,142 (p.13).
What changed after the consultation
- Cuts for volunteering were dropped. (CP 1707, p.15)
- A 15-year wait for jobs below degree level (RQF 6), including care work, was dropped. These workers go on the 10-year route. (CP 1707, p.38)
- Care workers who were on the route before the May 2025 White Paper keep a 5-year route if they meet the salary, sponsorship and job rules. (CP 1707, Chapter 8)
ILR reform timeline
- The immigration White Paper proposes raising the standard wait for settlement from 5 to 10 years, with shorter waits for people who contribute more. Source
- At Labour conference, Home Secretary Shabana Mahmood says settlement will depend on work, National Insurance, no benefits, good English and a clean record. Source
- The Home Office opens the earned settlement consultation, A Fairer Pathway to Settlement. It closes on 12 Feb 2026. Source
- New Immigration Rules (HC 1691) raise the English needed for settlement to B2 for main applicants who apply from 26 Mar 2027. Source
- The government publishes its response and the consultation analysis, and Mahmood makes a statement to the Commons. Source
The response gives no start date and no rule change has been laid before Parliament yet. It says guidance and a full impact assessment will come before the rules start.
Who answered the ILR consultation
The consultation had 202,241 responses from individuals and 2,426 from organisations, plus 904 by email. 73% of individuals (146,655) said they were current visa holders: the people whose wait for ILR the reform changes. 84% of individuals disagreed with the changes.
| Immigration status | Responses | Share |
|---|---|---|
| Current visa holder | 146,655 | 73% |
| British citizen | 35,412 | 18% |
| Settled status (ILR or EU settled status) | 9,288 | 5% |
| Refugee or humanitarian protection | 5,825 | 3% |
| Applying for UK immigration status or awaiting a decision | 2,184 | 1% |
| Asylum seeker | 1,074 | 1% |
Consultation respondents by ethnic group, compared with the census
19% of individual responses came from White respondents. At the 2021 census, 81.7% of residents of England and Wales were White. Asian respondents made up 51% of responses, against 9.3% of residents.
Share by ethnic group: consultation respondents and residents
- Consultation respondents (UK, 2026)
- Residents, Census 2021 (England and Wales)
| Ethnic group | Respondents | Share of respondents | Share of residents (2021) |
|---|---|---|---|
| White | 38,912 | 19% | 81.7% |
| Asian or Asian British | 103,584 | 51% | 9.3% |
| Black or Black British | 24,352 | 12% | 4.0% |
| Mixed or Multiple | 5,538 | 3% | 2.9% |
| Other ethnic group | 16,758 | 8% | 2.1% |
| Not stated | 13,097 | 6% | — |
- Anyone could answer the consultation. The Home Office analysis says the results are not representative of the public and were not weighted to match the population.
- The consultation covered the whole UK; 86% of individual respondents lived in England. The census figures are for England and Wales only, because Scotland and Northern Ireland run their own censuses.
- "Not stated" is our sum: the 202,241 total minus the five groups the analysis lists.
Net migration since 2021 and why the reform was tabled
Net migration was 2.5 million across 2021 to 2024, according to ONS long-term international migration estimates. That compares with about 229,000 a year from 2016 to 2019. It peaked at 891,000 in 2022.
| Year | Immigration | Emigration | Net migration |
|---|---|---|---|
| 2016 | 772,000 | 523,000 | 249,000 |
| 2017 | 752,000 | 544,000 | 208,000 |
| 2018 | 825,000 | 549,000 | 276,000 |
| 2019 | 788,000 | 605,000 | 184,000 |
| 2020 | 662,000 | 569,000 | 93,000 |
| 2021 | 947,000 | 480,000 | 467,000 |
| 2022 | 1,398,000 | 508,000 | 891,000 |
| 2023 | 1,441,000 | 593,000 | 848,000 |
| 2024 | 1,012,000 | 680,000 | 331,000 |
| 2025 | 813,000 | 642,000 | 171,000 |
Some politicians call this rise the “Boris wave”; Robert Jenrick used the term in the Commons on 2 Nov 2026.
| Visa | Granted | Year | Source |
|---|---|---|---|
| Health and Care Worker visas granted to main applicants | 146,477 | 2023 | Home Office |
| Health and Care Worker dependants | 203,452 | 2023 | Home Office |
| Student dependants | 143,595 | 2023 | Home Office |
People who arrived from 2021 to 2025 reach 5 years in the UK, the current wait for ILR, between 2026 and 2030. The Home Office estimated 1.6 million people would settle in those years (consultation, Nov 2025). Its response raises that central estimate to 1.9 million, within a range of 1.3 million to 2.2 million. It says earned settlement pushes over 500,000 of them later, bringing the estimate down to 1.4 million (CP 1707, Annex A, p.45).
Who has come to the UK since 2021
Of 5.2 million work, study, family, Ukraine and BN(O) visas issued from January 2021 to December 2025, 22% went to Indian nationals, 12% to Chinese and 10% to Nigerian. EU nationals received 5%.
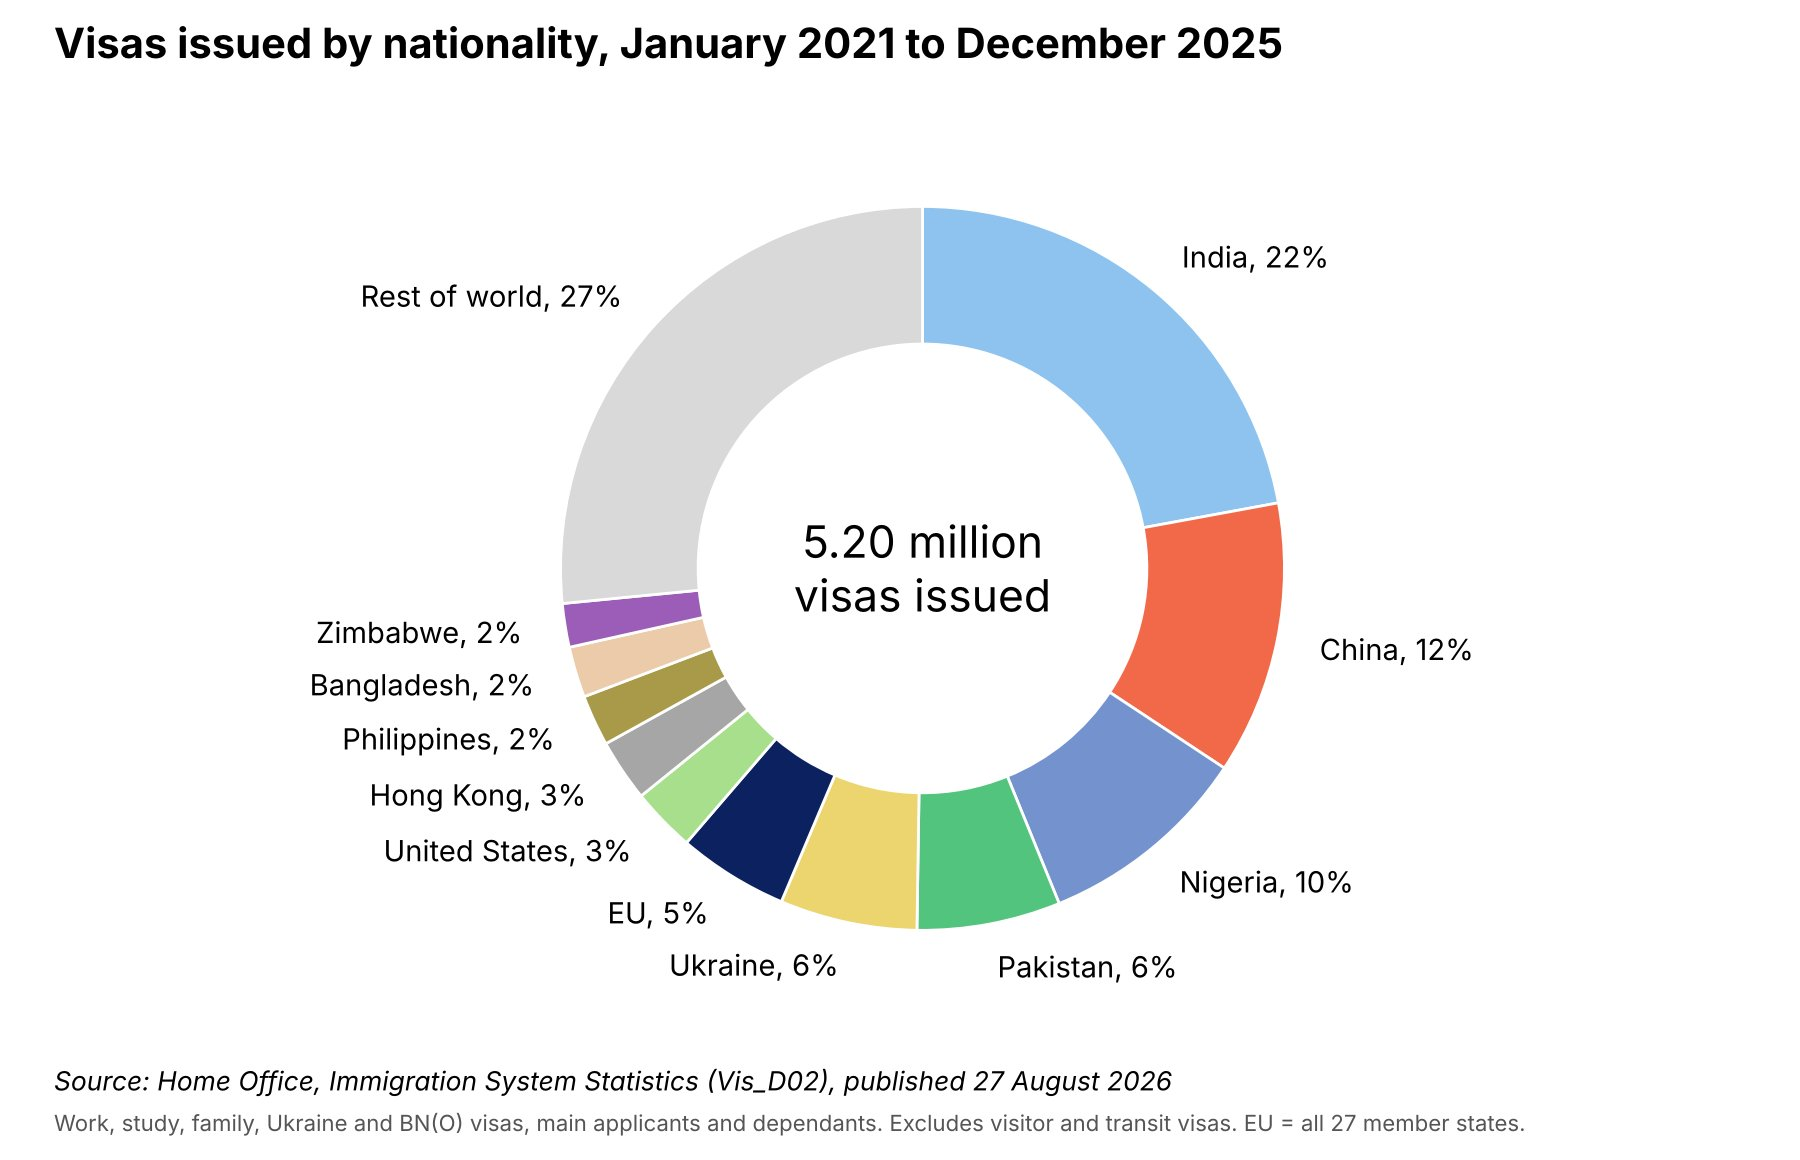
ONS estimates that 4.3 million non-EU+ nationals moved to the UK from 2021 to 2025, against 584,000 EU+ nationals. Since 2022 more EU+ nationals have left each year than arrived.
| Year | EU+ immigration | Non-EU+ immigration | EU+ net | Non-EU+ net |
|---|---|---|---|---|
| 2016 | 465,000 | 237,000 | 253,000 | 90,000 |
| 2017 | 411,000 | 257,000 | 176,000 | 114,000 |
| 2018 | 421,000 | 330,000 | 170,000 | 178,000 |
| 2019 | 349,000 | 368,000 | 80,000 | 186,000 |
| 2020 | 316,000 | 294,000 | 70,000 | 101,000 |
| 2021 | 173,000 | 610,000 | 15,000 | 522,000 |
| 2022 | 141,000 | 1,091,000 | −9,000 | 981,000 |
| 2023 | 103,000 | 1,188,000 | −53,000 | 1,005,000 |
| 2024 (revised) | 91,000 | 780,000 | −63,000 | 511,000 |
| 2025 (provisional) | 76,000 | 627,000 | −42,000 | 350,000 |
- EU+ is the 27 EU countries plus Norway, Iceland, Liechtenstein and Switzerland. Both groups exclude British nationals.
- Visas issued are grants, not arrivals: some people never travel, and one person can hold more than one visa over five years. EU nationals with settled status and Irish nationals need no visa, so the visa chart undercounts EU arrivals.
Lifetime fiscal impact by salary
The government's case rests on earnings: people who earn more pay more tax over their lives than they cost in public services and benefits. The Home Office estimates, using the Migration Advisory Committee's model:
| Salary | Lifetime net fiscal impact |
|---|---|
| £41,700 | +£347,000 |
| £50,271 | +£456,000 |
| £125,141 | +£1,530,000 |
For care workers, the Home Office put the lifetime net cost of 117,000 care workers and 79,000 adult dependants at £9.5 billion (Home Office, 5 Mar 2026).
Net fiscal position by ethnic group
The ONS measures whether households pay more in taxes than they receive in benefits and public services. A household that pays more than it receives is a net contributor.
| Ethnic group | Mean net position | 95% range | Households that are net contributors |
|---|---|---|---|
| White | −£6,452 | −£7,128 to −£5,777 | 63.1% |
| Asian or Asian British | +£602 | −£2,115 to +£3,319 | 51.2% |
| Black, Black British, Caribbean or African | +£4,126 | +£1,039 to +£7,214 | 45.7% |
| Mixed or Multiple | −£1,274 | −£9,081 to +£6,534 | 51.1% |
| Other ethnic group | +£2,183 | −£2,793 to +£7,160 | 55.4% |

- Only the White group (net contributor) and the Black group (net recipient) have 95% ranges that do not cross zero in the ONS table. For the other groups the survey cannot say which side of zero they are on.
- The table covers non-retired households over three years; the chart covers all households in one year, so the figures differ. Age matters: households with children or low earnings receive more.
- These figures are by ethnic group, not by migration status. Many people in every group were born in the UK. Neither measure is the fiscal impact of the people affected by earned settlement.
What the parties said
In the Commons statement on 2 Nov 2026 (Hansard), in our words:
| Party | Speaker | What they said |
|---|---|---|
| Labour | Shabana Mahmood, Home Secretary | Said the policy is about fairness to people who come legally and contribute, and to British citizens already here. |
| Conservatives | Chris Philp, shadow Home Secretary | Said keeping a 5-year route for existing care workers goes back on what the Home Secretary had said before. |
| Liberal Democrats | Max Wilkinson | Said the reforms are falling apart and asked the government to publish their full economic impact. |
| Reform UK | Robert Jenrick | Said the changes risk making the 2021 to 2024 rise in migration permanent, and asked whether she would resign. |
| Green Party | Hannah Spencer | Said letting higher earners settle faster is unfair on lower-paid workers. |
| Your Party | Jeremy Corbyn | Asked why very high earners are put ahead of lower-paid care workers. |
| Restore Britain | — | Did not speak in the statement. |